Chef 360 Platform Admin Console dashboard
The dashboard provides quick access to the most commonly used features of the Chef 360 Platform Admin Console. Many of these options (such as config, version history, and licensing) are available in dedicated screens providing advanced details or activities.
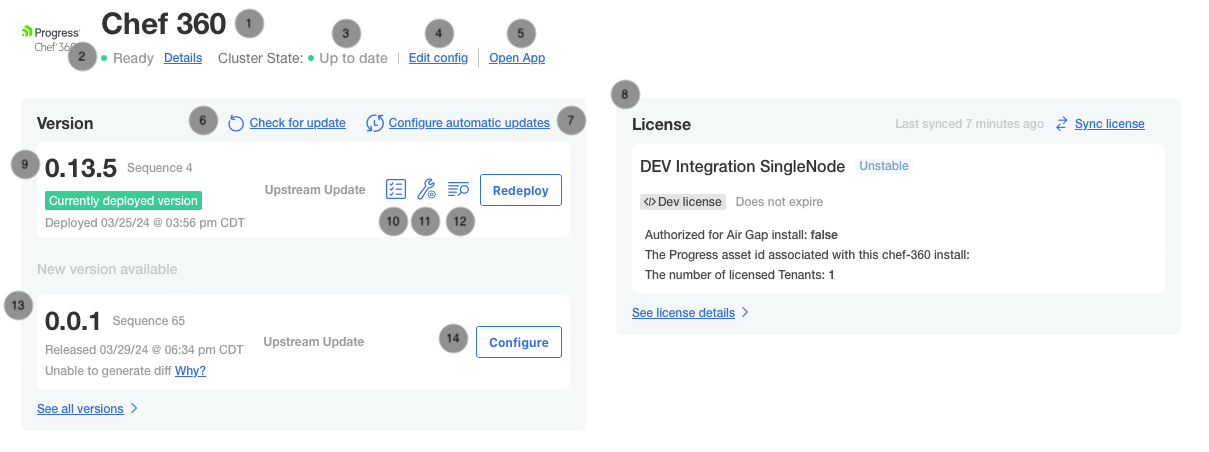
The admin dashboard has the following features:
- This is the name of the deployed application. It’s Chef 360 Platform (commercial) or Chef Platform (community) depending on your distribution.
- An indicator of the status of your cluster and application. CLicking Details opens a screen showing all tracked service statuses.
- The cluster status indicates if the cluster is online and on the latest version of Kubernetes runtime.
- Clicking Edit config allows you to edit the currently deployed versions configuration and deploy a new version of the application.
- Clicking Open App opens the default tenant (based on its DNS entry) in a new browser window.
- Clicking Check for update triggers a check for new versions of the application (if you aren’t air-gapped).
- Clicking Configure automatic updates allows you to edit the automatic update settings. Refer to the Automatic updates page for further details.
- The license information is displayed at a glance. For detailed information, go to the license screen.
- The current version of the application.
- The ability to view and re-run pre-flight checks for the deployed version.
- The ability to configure the current version (the same as clicking Edit config at the top of the page).
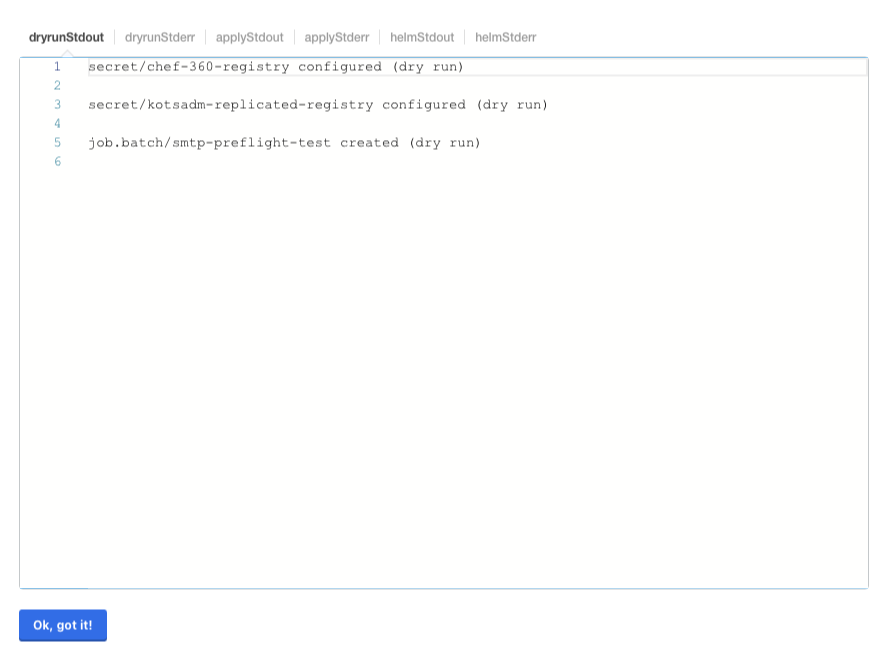
- View the deployment logs.
- The latest version available.
- Clicking Configure edits the configuration to prepare to deploy the latest version of the application.
Redeploying an application
Redeploying an application uses the existing configuration settings to force the cluster to re-apply all settings, deploying the current version of the application with all of its current settings.
Resource status
Click Details in the cluster status indicator.

Deployment logs